eBPF Observability: Low-Latency Insights

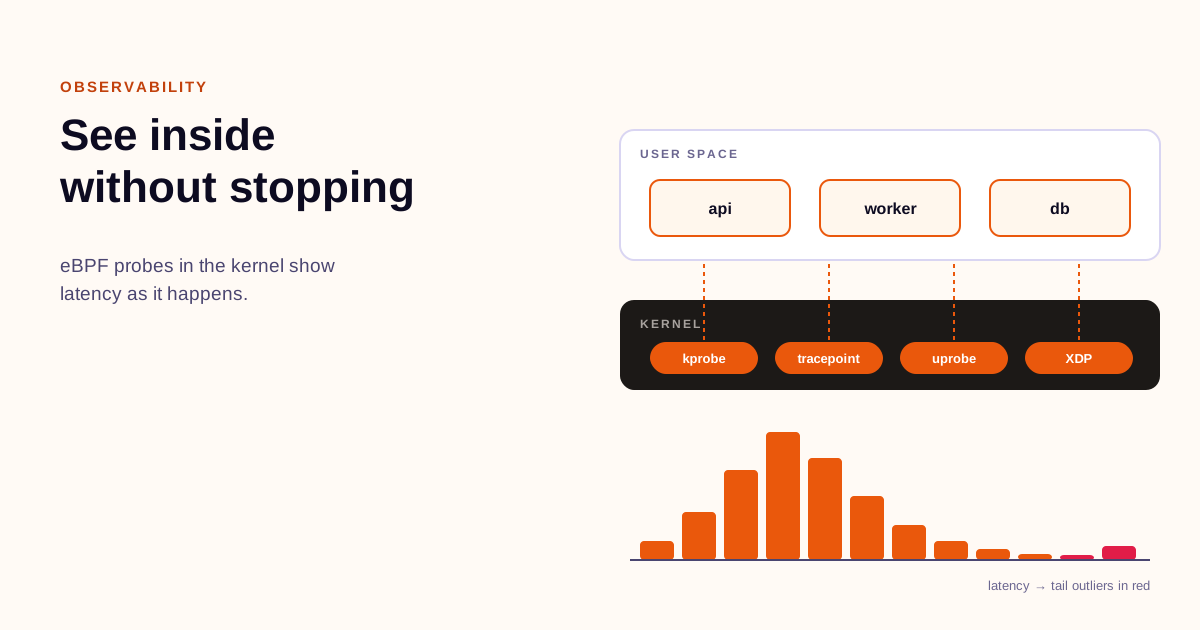
Adding eBPF observability to a product gives operators a way to see what is actually happening inside running systems without stopping the line, redeploying code, or adding heavy agents. For teams in manufacturing, supermarkets, banking, education, health tech, fintech and tax returns the appeal is the same: you need real-time signals about performance and health, and you cannot afford downtime or a new source of load in environments where reliability, compliance and cost are tightly coupled.
The pattern is not sector-specific. A retail point-of-sale cluster, a bank’s payment gateway, a hospital’s imaging pipeline and a tax filing backend all share the same constraints: production systems must stay up, changes are slow, and the cost of missing an incident is measured in revenue, trust or patient safety. eBPF can be framed for those contexts without inventing sector vocabulary.
Benefits of eBPF for Observability
Low-latency insight via shared maps When instrumentation lives in the kernel and writes to shared maps, user-space applications, GPU code and eBPF programs can interact with the same eBPF maps shared by the rest of the system [1]. The shared memory approach guarantees low-latency communication between user-space applications, GPU code, and eBPF maps, which is essential for real-time or performance-critical instrumentation [1].
Consistent monitoring across CPU and GPU The same map sharing lets you keep monitoring, collection or filtering logic consistent across CPU and GPU boundaries [1]. That matters when you have mixed workloads, for example analytics services running alongside GPU-accelerated inference in health tech or fintech risk models.
Operational flexibility The bpftrace binary is installed on all target systems, but the bpftrace tools live on a web server and are pushed out when needed [2]. That separation lets a central team update observability scripts without touching each host.
Trade-offs of eBPF for Observability
Learning curve Learning bcc and BPF well takes weeks, and learning the subtleties and pitfalls of system tracing can take months or years [2]. For teams in regulated industries, that learning curve is a resourcing decision, not just a technical one.
Ongoing maintenance BPF software, especially certain kprobe-based tools, require ongoing maintenance [2]. A tool may work on one kernel and break on the next as a traced function is renamed or a code path changes. In manufacturing or banking where change control is strict, that fragility must be planned for.
Security and stability eBPF programs run in kernel context. A bug can be more than noisy metrics. In health tech and fintech, where auditability is required, you need guardrails for who can load programs, what they can attach to, and how long they run.
| Dimension | eBPF Observability | Traditional Agent-Based Observability |
|---|---|---|
| Overhead & Deployment | Kernel-level, low per-event cost; binary on host, tools pushed remotely [2] | Per-process agent, higher baseline CPU/memory; agent install + config per host |
| Latency & Maintenance | Near real-time via shared maps [1]; kernel version sensitive, needs updates [2] | Polling / batch shipping delays; agent versioning, less kernel coupling |
| Learning curve | Weeks to months for proficiency [2] | Days to weeks |
Step-by-Step Guide to Implementing eBPF in Your Product
A pragmatic rollout keeps blast radius small and builds confidence.
1. Define the signal and success metric Choose one high-value signal. Examples: p99 request latency on a payment API, queue depth on a supermarket inventory service, or job completion time in a manufacturing MES. Define success as a measurable reduction in mean time to detect.
2. Provision a safe host fleet Install the bpftrace binary on all target systems, but keep the bpftrace tools on a web server and push them out when needed [2]. This keeps hosts minimal and lets you version control observability scripts.
3. Design the data path Use eBPF maps as the in-kernel buffer and expose them to user-space for collection. eBPF maps can be accessed by both user-space components and CUDA code [1]. That shared memory design enables low-latency handoff without copying large volumes of data.
4. Attach programs to the right events The user-space variant shown can attach to higher-level events, including application-level function calls or GPU hooks, according to the user's needs [1]. Choose kprobes, tracepoints or uprobes that map directly to your signal. Avoid broad probes in production until you have baselines.
5. Collect, aggregate and alert Read maps from user-space on a short interval, aggregate locally, and ship summaries. Keep raw event capture limited to troubleshooting windows.
6. Operationalize Version tools, test against your kernel matrix, and document rollback. Because BPF software requires ongoing maintenance [2], treat programs like production code with CI checks for kernel compatibility.
A simple lifecycle helps teams track maturity.
A minimal bpftrace example for latency sampling illustrates the tooling pattern. This is illustrative only; real programs need validation for your kernel and workload.
# Example: sample socket receive latency on a service port
bpftrace -e 'kprobe:tcp_rcv_established { @start[tid] = nsecs; }
kretprobe:tcp_rcv_established /@start[tid]/ { @lat = hist(nsecs - @start[tid]); delete(@start[tid]); }'
eBPF Maps and Low-Latency Communication
The core of low-latency eBPF observability is map sharing. Toward the lower-middle portion, there is a shared memory region used to hold eBPF maps. This shared memory is accessible not only to the user-space components but also to the CUDA code indicated on the right [1].
Think of eBPF maps as a whiteboard in kernel memory. An eBPF program writes a counter or timestamp to the board, and a user-space collector reads it without a system call per event. The same board can be consumed by GPU code for coordinated telemetry, which is valuable when inference and serving run side-by-side.
The shared memory approach guarantees low-latency communication between user-space applications, GPU code, and eBPF maps, which is essential for real-time or performance-critical instrumentation [1]. For banking or health tech, that translates to faster detection of latency spikes during peak load without adding load.
Challenges and Considerations for eBPF Adoption
Skill and ownership As noted, learning bcc and BPF well takes weeks, and learning the subtleties and pitfalls of system tracing can take months or years [2]. Budget for mentorship and pair reviews, and designate owners for kernel compatibility.
Kernel churn BPF software, especially certain kprobe-based tools, require ongoing maintenance [2]. Plan a kernel support matrix and automated tests that load programs on each supported version.
Security boundaries Loading eBPF programs requires privileges. In regulated environments, enforce code signing, audit logs for program loads, and least-privilege attachment points.
Scope creep eBPF is powerful enough to tempt teams into building full APM inside the kernel. Keep it focused on signals you cannot get otherwise.
Real-World Examples and Use Cases
Manufacturing: Monitor PLC gateway latency and message queue depth on edge servers using shared maps for coordinated telemetry.
Supermarkets: Observe checkout service tail latency during peak hours. Shared maps let the observability collector and the service share counters without extra copies.
Banking / FinTech / Tax Returns: Trace authentication and payment path latency end-to-end. User-space eBPF can attach to higher-level events, including application-level function calls or GPU hooks, according to the user's needs [1], enabling correlation between business events and kernel metrics.
Education / HealthTech: Track batch job completion for grading pipelines or medical imaging preprocessing. Low-latency maps reduce the delay between an anomaly and alerting.
Across these sectors the subject means the same thing: safer, faster visibility with bounded overhead. The constraints differ — uptime SLAs, compliance audits, hardware limits — but the decision calculus is comparable.
eBPF observability is not a silver bullet. It rewards disciplined scope, careful maintenance, and a team willing to invest in kernel-level skills. When used narrowly for the most critical signals, it delivers real-time insights that agent-based telemetry struggles to match.
References
- eGPU: Extending eBPF Programmability and Observability to GPUs — camps.aptaracorp.com (10 April 2025)
- How To Add eBPF Observability To Your Product — brendangregg.com